|
2017 |
2018 |
2019 |
2020 |
2021 |
CAGR (%) |
|---|---|---|---|---|---|---|
Combined Revenue |
65.6 |
88.1 |
97.6 |
104.0 |
151.6 |
23.3 |
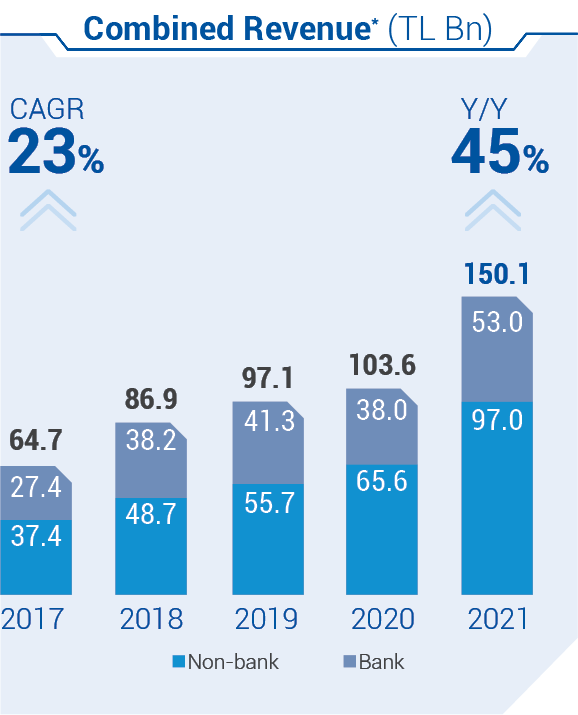
Combined Revenue* |
64.7 |
86.9 |
97.1 |
103.6 |
150.1 |
23.4 |
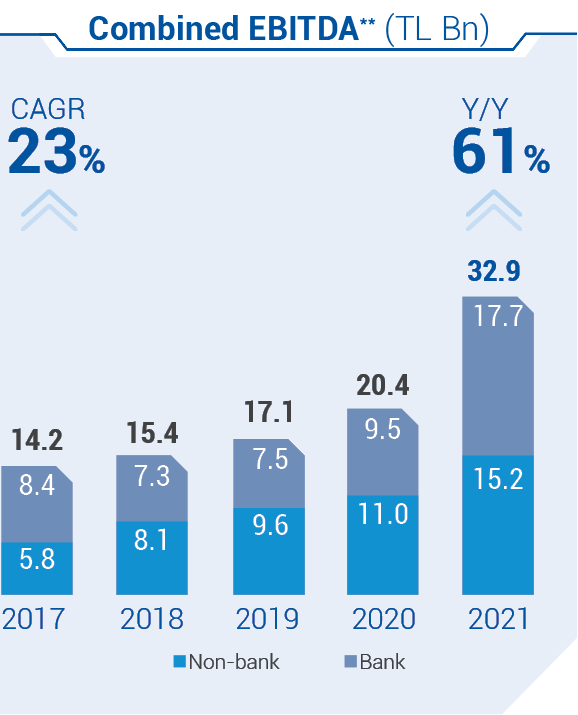
Combined EBITDA** |
14.2 |
15.4 |
17.1 |
20.4 |
32.9 |
23.4 |
Consolidated Net Income (Share of Parent Company) |
3.5 |
3.8 |
3.8 |
4.8 |
12.0 |
36.1 |
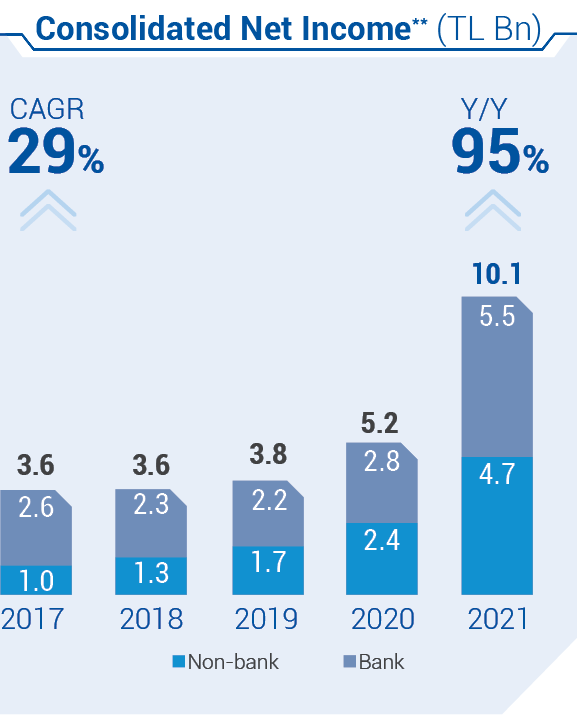
Consolidated Net Income** (Share of Parent Company) |
3.6 |
3.6 |
3.8 |
5.2 |
10.1 |
29.4 |
Combined Operational Cash Flow *** |
4.6 |
5.6 |
9.5 |
10.8 |
12.4 |
28.1 |
Holding Solo Net Cash |
1.7 |
2.6 |
1.7 |
1.1 |
2.5 |
10.1 |
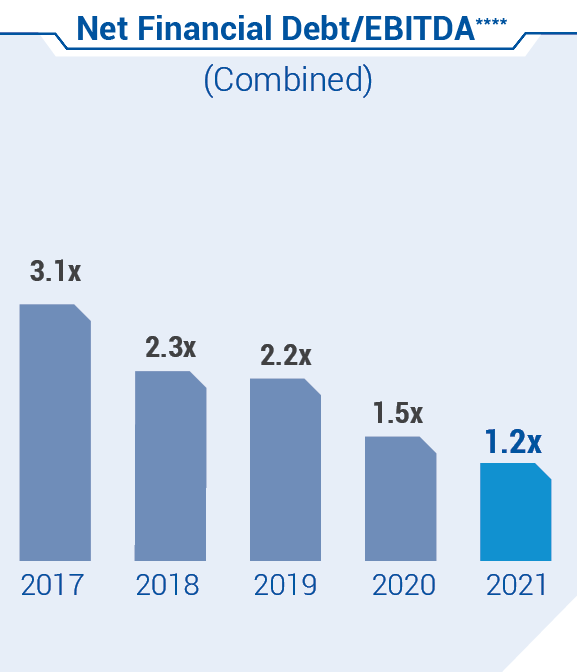
Combined Net Financial Debt/EBITDA**** |
3.1x |
2.3x |
2.2x |
1.5 x |
1.2x |
|